How to get your k6 performance test metrics into Splunk?

K6 is really a great product and very easy to setup. The question is, what do you do with the results? If you bought k6 as part of your Grafana Cloud subscription it's easy but if you want to use the open source product in your CI/CD pipelines or just run at your own schedule? You need to have the data somewhere for analysis.
Wouldn't it be great if you have it in Splunk Enterprise together with your system metrics and all relevant logfiles? I think that would be great! Let's go!
The setup
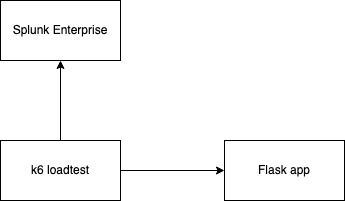
The setup is quite simple.
- I've build a simple Flask app which can be called using HTTP requests
- A k6 container contains a loadtest script which runs against the Flask app
- Loadtest results are streamed in a statsd (metrics) format to Splunk Enterprise
For this guide, everything has been build using docker compose.
Flask app
The Flask app consists of app.py, wsgi.py and a requirements.txt. It's glued together in a Dockerfile.
from flask import Flask, request, jsonify
app = Flask(__name__)
@app.route('/')
def hello():
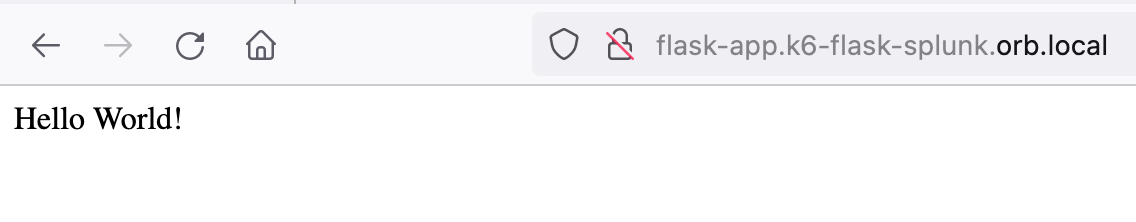
return "Hello World!"
@app.route('/info')
def info():
resp = {
'connecting_ip': request.headers['X-Real-IP'],
'proxy_ip': request.headers['X-Forwarded-For'],
'host': request.headers['Host'],
'user-agent': request.headers['User-Agent']
}
return jsonify(resp)
@app.route('/flask-health-check')
def flask_health_check():
return "success"app.py file
from app import app
import os

if __name__ == "__main__":
    app.run(host='0.0.0.0', port=os.environ.get("FLASK_SERVER_PORT"), debug=True)
wsgi.py file
Flask
gunicorn
requirements.txt file
FROM python:3.11.5-alpine3.17

# upgrade pip
RUN pip install --upgrade pip

# get curl for healthchecks
RUN apk add curl

# permissions and nonroot user for tightened security
RUN adduser -D nonroot
RUN mkdir /home/app/ && chown -R nonroot:nonroot /home/app
RUN mkdir -p /var/log/flask-app && touch /var/log/flask-app/flask-app.err.log && touch /var/log/flask-app/flask-app.out.log
RUN chown -R nonroot:nonroot /var/log/flask-app
WORKDIR /home/app
USER nonroot

# copy all the files to the container
COPY --chown=nonroot:nonroot . .

# venv
ENV VIRTUAL_ENV=/home/app/venv

# python setup
RUN python -m venv $VIRTUAL_ENV
ENV PATH="$VIRTUAL_ENV/bin:$PATH"
RUN export FLASK_APP=app.py
RUN pip install -r requirements.txt

# define the port number the container should expose
EXPOSE 5000

CMD ["python", "app.py"]
Dockerfile
Service definition in docker-compose.yml
  flask-app:
    build: flask
    restart: always
    ports:
      - '8000:8000'
    healthcheck:
      test: ["CMD-SHELL", "curl --silent --fail localhost:8000/flask-health-check || exit 1"]
      interval: 10s
      timeout: 10s
      retries: 3
    command: gunicorn -w 3 -t 60 -b 0.0.0.0:8000 app:app
    container_name: flask-app
Docker-compose flask service definition
k6
k6 is a loadtest project based on JavaScript files. It was started as an open source project and later aqcuired by Grafana to be part of the Grafana Cloud solution. The open source project is still available and updated but may lack certain features. For us that is not a problem because we don't need them.
k6 is super easy to setup.
- Run a k6 container with the correct environment variables
- Put the loadtest script in the container
- Run when needed (I run it manually but it can be easily integrated into a CI/CD pipeline)
Below you will find the docker-compose service definition. The important part is the volume (to get the script in the container) and the environment variables. For statsd output there are multiple options for which you can find an explanation on the k6 website. Here all I need is the K6_OUT var set to statsd and the K6_STATSD_ADDR set to the TCP input I'll define in my Splunk Enterprise container.
  k6:
    image: grafana/k6:latest
    container_name: k6
    ports:
      - "6565:6565"
    environment:
      - K6_OUT=statsd
      - K6_STATSD_ADDR=splunk-k6:8125
    volumes:
      - ./scripts:/scripts
Docker-compose k6 service definition
import http from 'k6/http';
import { sleep } from 'k6';

export const options = {
  stages: [
    { duration: '1m', target: 5 }, // simulate ramp-up of traffic from 1 to 5 users over 1 minute.
    { duration: '3m', target: 5 }, // stay at 5 users for 3 minutes
    { duration: '1m', target: 0 }, // ramp-down to 0 users
  ],

  thresholds: {
    http_req_failed: ['rate<0.01'], // http errors should be less than 1%
    http_req_duration: ['p(99)<1500'], // 99% of requests must complete below 1.5s
  },
};

export default function () {
  http.get('http://flask-app:8000/info');
  sleep(1);
}
k6 loadtest script
The beauty of a k6 loadtest script is that it contains the actions it needs to execute, the testscenario that needs to be exectued and the thresholds it needs to monitor. For a full list of opportunities visit their website.
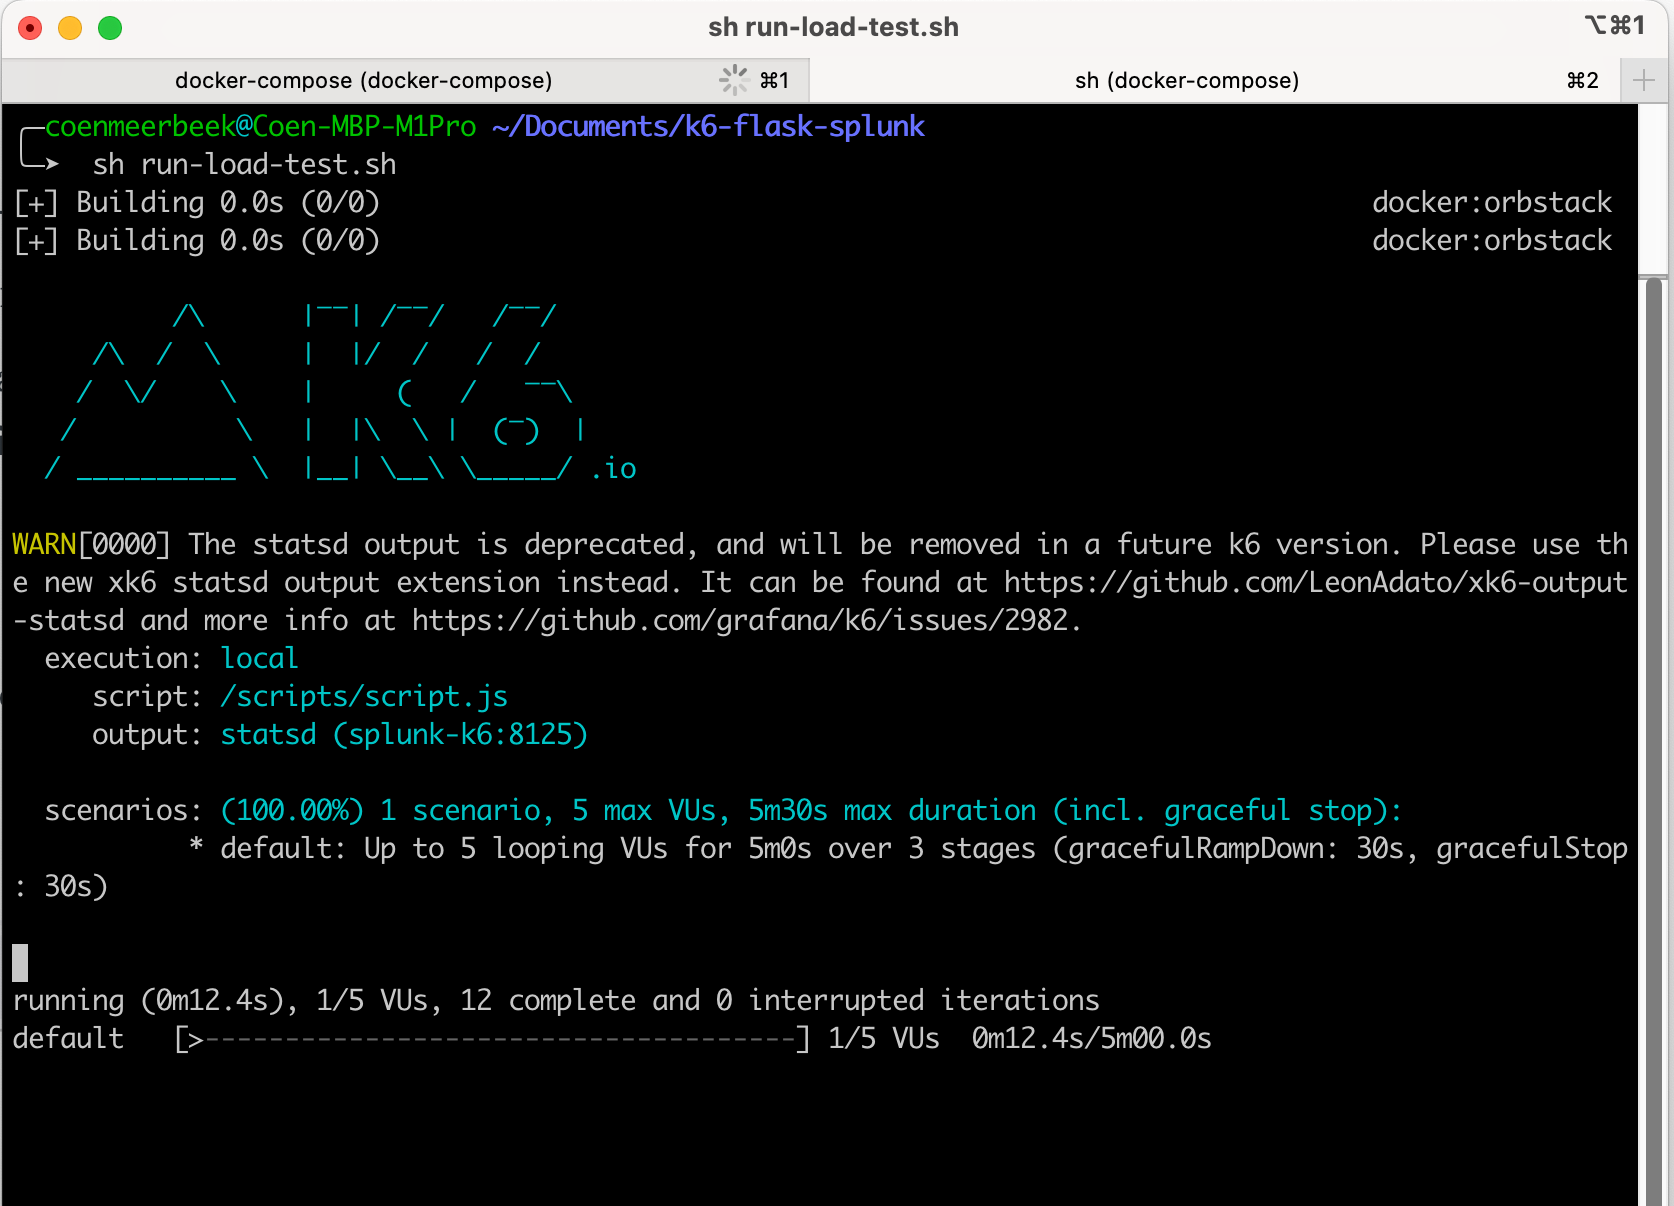
Now we need something to run the k6 script when I want to. It's nothing more than a docker-compose run command which, if need be, can be wrapped in a shell script.
docker-compose run --rm k6 run /scripts/script.jsSplunk setup
There is the docker-compose definition which is almost the same as used in my other post about sending Prometheus metrics to Splunk using the OTEL collector. If you want to learn more I suggest reading the post.
  splunk-k6:
    image: splunk/splunk:latest
    container_name: splunk-k6
    environment:
      - SPLUNK_START_ARGS=--accept-license
      - SPLUNK_HEC_TOKEN=00000000-0000-0000-0000-0000000000000
      - SPLUNK_PASSWORD=changeme
    ports:
      - 18000:8000
    healthcheck:
      test: [ 'CMD', 'curl', '-f', 'http://localhost:8000' ]
      interval: 5s
      timeout: 5s
      retries: 20
    volumes:
      - ./splunk.yml:/tmp/defaults/default.yml
      - /opt/splunk/var
      - /opt/splunk/etc
Splunk Enterprise docker-compose service definition
The splunk.yml is now the more interesting part.
splunk:
    conf:
      indexes:
        directory: /opt/splunk/etc/apps/search/local
        content:
          k6-metrics:
            coldPath: $SPLUNK_DB/k6-metrics/colddb
            datatype: metric
            homePath: $SPLUNK_DB/k6-metrics/db
            maxTotalDataSizeMB: 512000
            thawedPath: $SPLUNK_DB/k6-metrics/thaweddb
      inputs:
        directory: /opt/splunk/etc/system/local
        content:
          udp://8125:
            connection_host: ip
            index: k6-metrics
            sourcetype: statsd
splunk.yml definitions
I do 2 things.
- Create a metrics-based index called k6-metrics.
- Create an input which listens on port 8125 on the udp protocol.
- The sourcetype is set to statsd so that Splunk Enterprise can automatically parse the data into the correct metrics format
The results
Now we can starting spinning up the environment.
Flask:
k6:
And finally the results in Splunk:
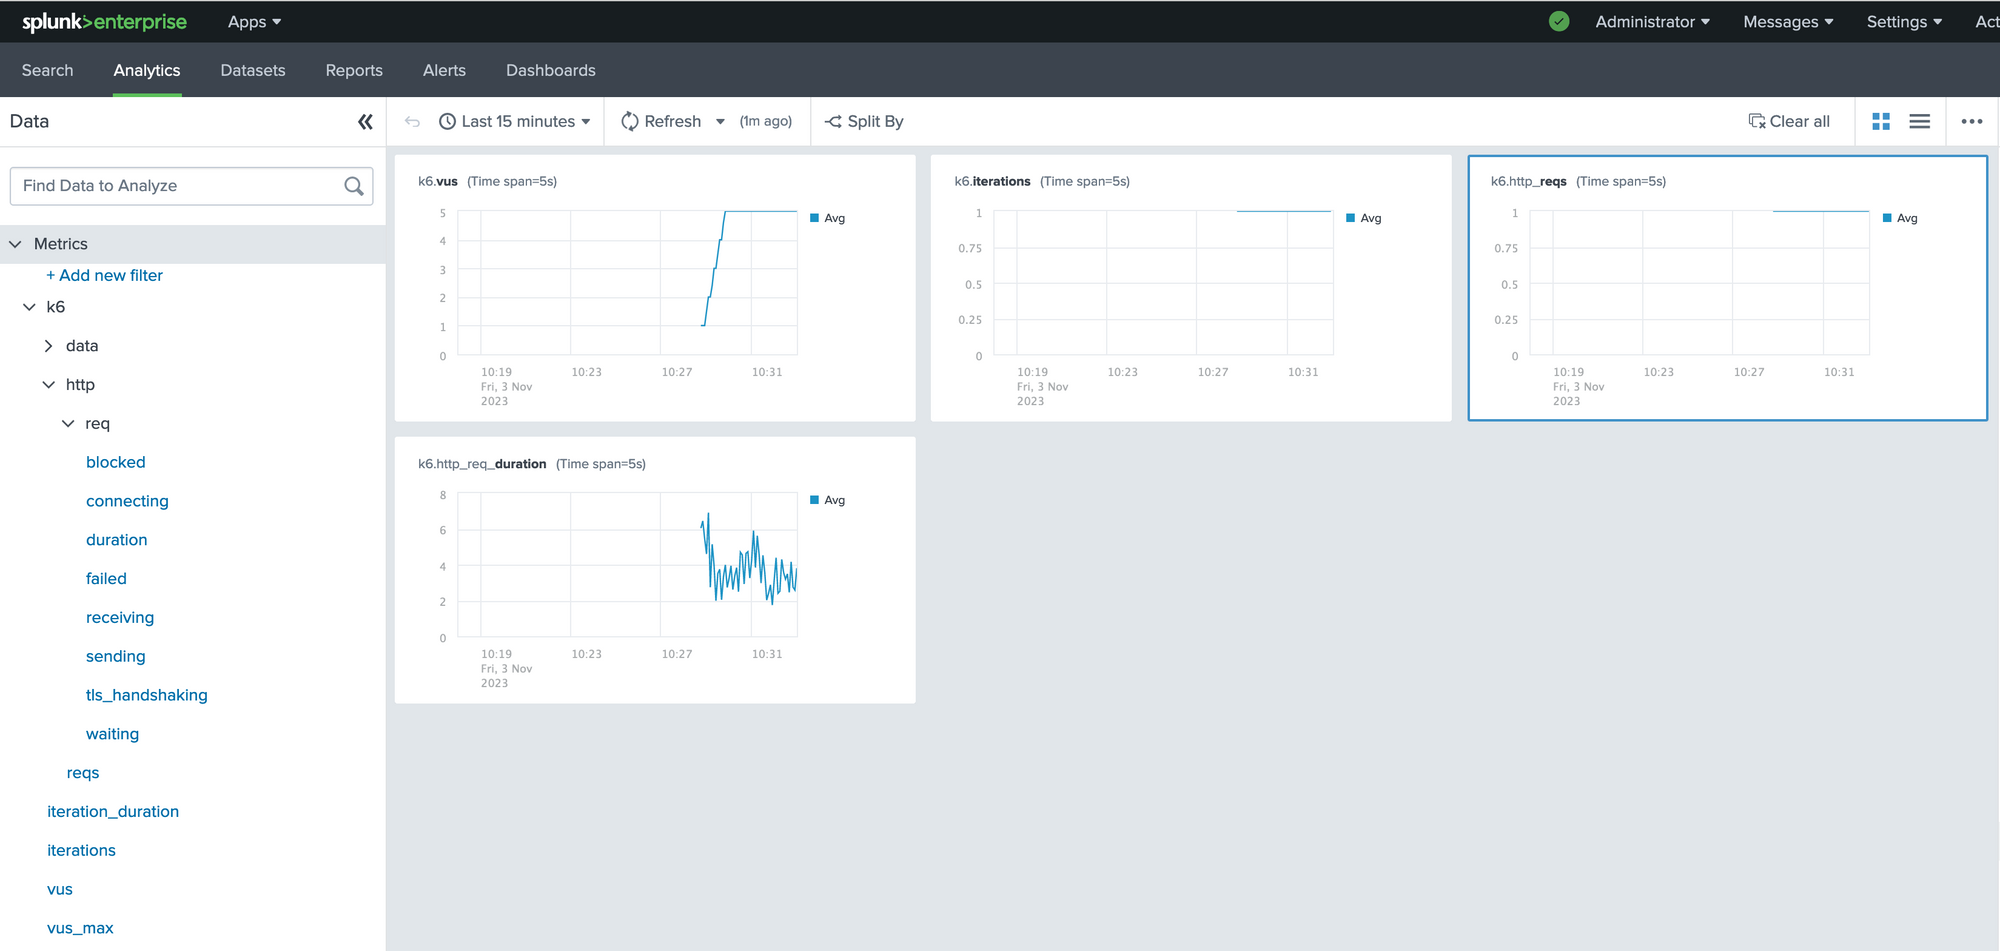
Some highlights;
- k6 is a super easy loadtesting tool which can be used locally or in a CI/CD setup
- Running Splunk Enterprise in containers was already easy but now you see how easy it is to define inputs to get data in
- Again, the power of a metric based index is shown here where we can correlate all sorts of metrics quite easily