How to get Prometheus metrics into Splunk using OpenTelemetry?

The first time I wanted to get Prometheus-based metrics into Splunk I looked into my Splunk toolbelt to find a simple solution but couldn't find one. I could scrape the full body of the endpoint and parse it later or write a custom Python script to get it. Not an ideal situation at all.
Enter OpenTelemetry
The OTEL Collector supports scraping metrics from a Prometheus endpoint and the OTEL Collector contrib release supports Splunk HTTP Event Collector and SignalFX metrics exporters. Awesome! Let's dive in.
The setup
To simplify the setup I will use a docker compose setup to get it all working. If applicable I will add details on how to do this in a traditional server setup.
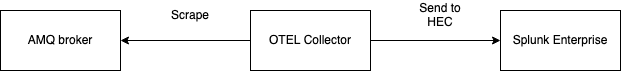
Here you see how simple it looks.
- AMQ exposes a /metrics endpoint on port 8161
- The OTEL Collector scrapes this endpoint
- The OTEL Collector sends the collected metrics to the HEC on Splunk Enterprise
The AMQ broker
The AMQ broker service definition as follows:
  amq-demo-broker:
    image: registry.redhat.io/amq7/amq-broker-rhel8:7.10-53.1675799519
    container_name: amq-demo-broker
    ports:
      # ui
      - "8161:8161"
      # all protocols
      - "61616:61616"
    volumes:
      - ./broker/broker.xml:/opt/amq/conf/broker.xml
    environment:
      AMQ_USER: "admin"
      AMQ_PASSWORD: "admin"
First I get the Red Hat AMQ image from their registry. You can also use the Apache release from Docker Hub.
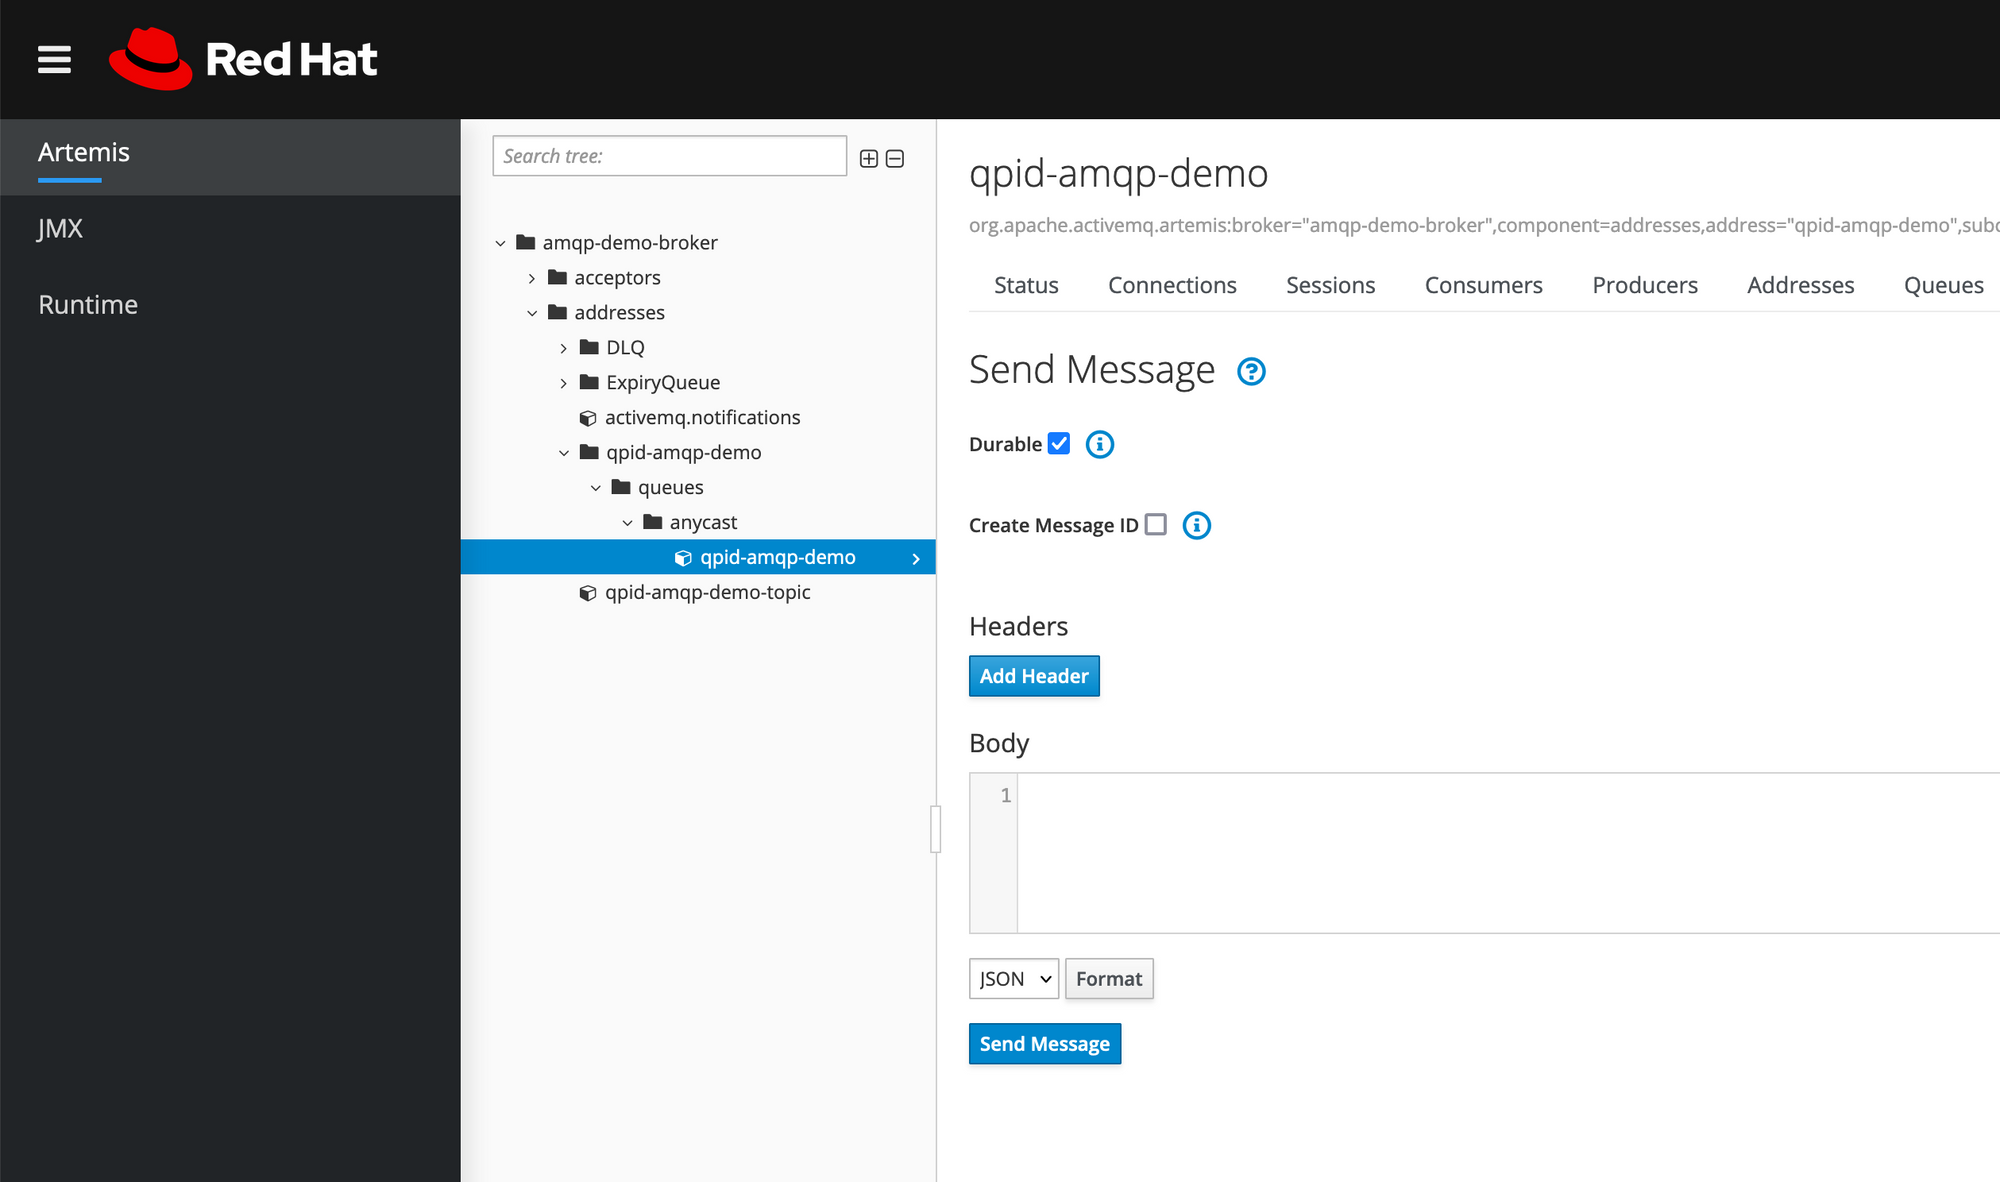
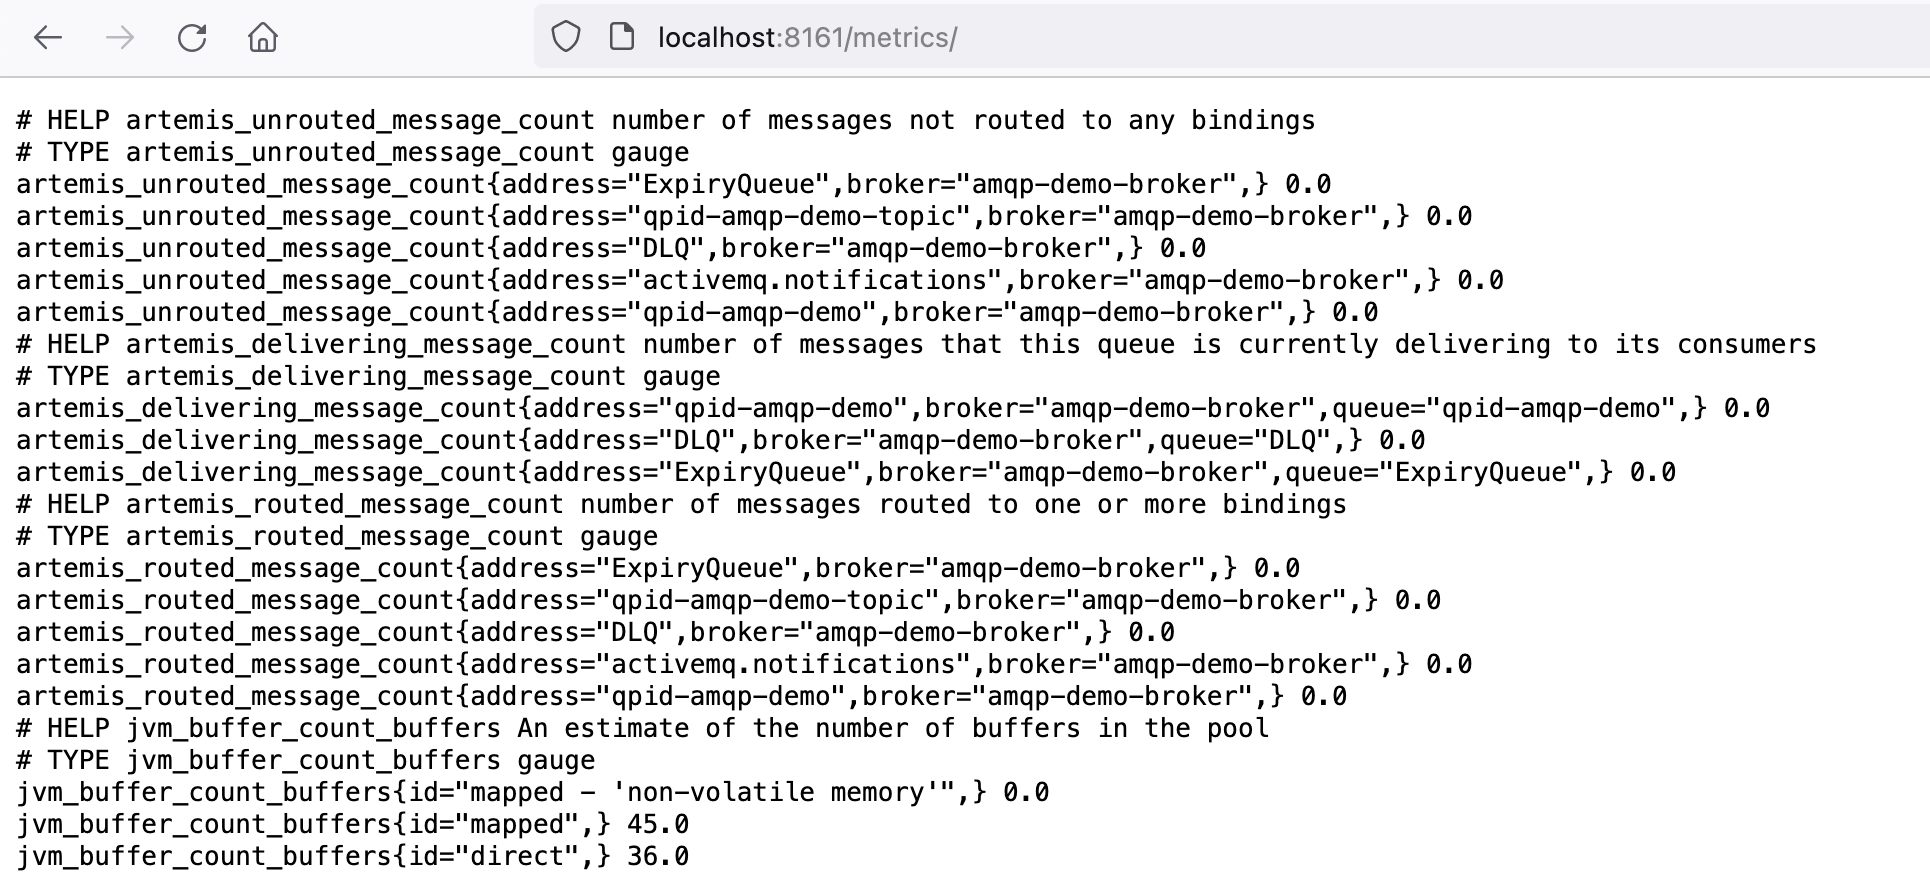
I've exposed the 8161 port to my dev machine so I can verify the /metrics endpoint but that is not needed perse. The 616161 port is for exposing the broker UI so I can login and send some test messages.
Important here is the broker.xml file. This is needed to configure the broker, for example to expose the /metrics endpoint which is not enabled by default.
<metrics>
  <plugin class-name="org.apache.activemq.artemis.core.server.metrics.plugins.ArtemisPrometheusMetricsPlugin"/>
</metrics>
This is not the full content of the broker.xml but only the part to enable the /metrics endpoint. Full broker.xml can be found in my corresponding GitHub repository.
The Splunk Enterprise instance
The Splunk Enterprise Docker container is quit complex behind the curtains but it very easy to setup and run locally to try out all sorts of stuff so I use it a lot.
The Docker service:
  splunk:
    image: splunk/splunk:latest
    container_name: splunk
    environment:
      - SPLUNK_START_ARGS=--accept-license
      - SPLUNK_HEC_TOKEN=00000000-0000-0000-0000-0000000000000
      - SPLUNK_PASSWORD=changeme
    ports:
      - 18000:8000
    healthcheck:
      test: [ 'CMD', 'curl', '-f', 'http://localhost:8000' ]
      interval: 5s
      timeout: 5s
      retries: 20
    volumes:
      - ./splunk.yml:/tmp/defaults/default.yml
      - /opt/splunk/var
      - /opt/splunk/etc
I always get the latest Splunk Enterprise image which usually lags a few weeks behind the binary release of Splunk Enterprise. This is great because any crucial bugs is usually squashed before the Docker image is available.
I set 3 ENV variables here:
- SPLUNK_START_ARGS to make sure the license is accepted at first startup. If you don't do this the start will be on-hold and you have to do it manually.
- SPLUNK_HEC_TOKEN to enable the HEC endpoint and set a default token so you can start sending data. This off-course not for production environments :-)
- SPLUNK_PASSWORD to make sure you can login to the Splunk UI.
Port mapping is also used to be able to open the Splunk UI from my dev machine.
The volumes are important as well.
- splunk.yml is a local configuration file which needs to end up in /tmp/defaults/splunk.yml where an Ansible script will pick it up and create all the needed conf files which you want to have in place. I'll explain more later.
- The /opt/splunk/var and /opt/splunk/etc volumes allow you to inspect what happens in those folders. You could also map them to a folder on your local machine so that if you stop the Splunk container and start it back up it will continue where it left of.
As said, the splunk.yml is the config as code file for the Splunk Enterprise container.
splunk:
    conf:
      indexes:
        directory: /opt/splunk/etc/apps/search/local
        content:
          amq-metrics:
            coldPath: $SPLUNK_DB/amq-metrics/colddb
            datatype: metric
            homePath: $SPLUNK_DB/amq-metrics/db
            maxTotalDataSizeMB: 512000
            thawedPath: $SPLUNK_DB/amq-metrics/thaweddb
This file works as follows:
- You specify the root as splunk
- Then you use conf for managing traditional Splunk conf-files.
- After that you specify which conf file you want to work with. Just put the name of the file here without .conf like indexes or props or inputs.
- Then specify a directory in which the file needs to be put. If you don't care about the file being in a specific app I usually just put the file in /opt/splunk/etc/apps/search/local or /opt/splunk/etc/system/local.
- After that you specify the content. The content maps to the stanza in a conf file and the attributes you can use based on what docs.splunk.com tells you. In the example above the settings I've specified land in an indexes.conf as seen below and you are probably familar with.
- You can add all your conf settings in this one splunk.yml. Make sure your indents are correct ;-)
[amq-metrics]
coldPath = $SPLUNK_DB/amq-metrics/colddb
datatype = metric
homePath = $SPLUNK_DB/amq-metrics/db
maxTotalDataSizeMB = 512000
thawedPath = $SPLUNK_DB/amq-metrics/thaweddb
Please note the datatype setting. The OTEL collector will scrape the metrics in a metrics format like statsd, therefore we need an index which is of type metrics. This is a good thing because metric-based indexes are lightning fast to query and are very small. A much underrated feature of Splunk Enterprise tbh!
The OTEL Collector
Now on to the most important instance. The OpenTelemetry collector. It is a tool to connect receivers (inputs), to processors, to exporters (outputs). Pretty straightforward, especially if you have experience with Fluentd for example.
Note; there are 2 flavours of the OTEL collector. The vanilla and the contrib one.
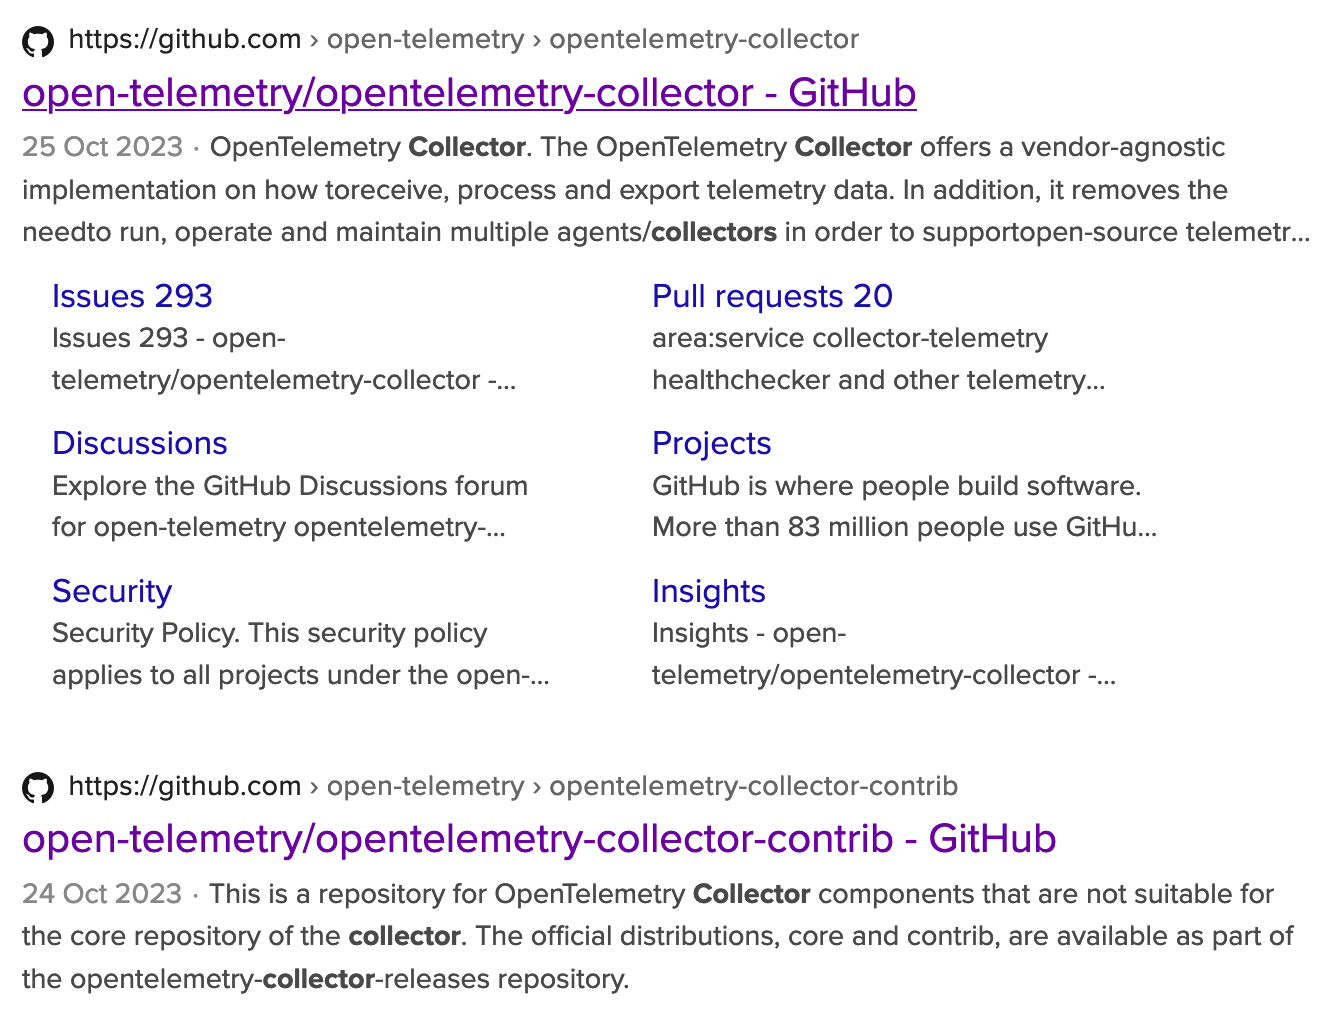
The first one is the base open-source one ran by the CNCF. The second one is based on the first one but contains receivers, processors and exporters from all vendors supporting the OpenTelemetry project like Splunk, DataDog and Cisco. Also some vendors provide their own Docker image based on contrib like Splunk so that is the one I will be using.
  otelcollector:
    image: quay.io/signalfx/splunk-otel-collector:0.71.0
    container_name: otelcollector
    command: ["--config=/etc/otel-collector-config.yml", "--set=service.telemetry.logs.level=debug"]
    volumes:
      - ./otel-collector-config.yml:/etc/otel-collector-config.yml
      - ./logs:/logs
The most important thing here is that you create the OTEL collector config file and map it to container and point to it at start-up.
The OTEL collector config file is the most important file of this setup which glues everything together.
Receiver
The receiver is getting or gets the data. In this case we start scraping the Prometheus endpoint of the AMQ broker.
receivers:
  prometheus:
    config:
      scrape_configs:
        - job_name: "amq-prom-metrics"
          metrics_path: /metrics
          static_configs:
            - targets: ["amq-demo-broker:8161"]
          scrape_interval: 60s
You specify a job_name, a metrics path, a target and a scrape_interval and that's it.
Exporter
Next up is the exporter since we don't do any processing.
exporters:
  splunk_hec/metrics:
    # Splunk HTTP Event Collector token.
    token: "00000000-0000-0000-0000-0000000000000"
    # URL to a Splunk instance to send data to.
    endpoint: "https://splunk:8088/services/collector"
    # Splunk index, optional name of the Splunk index targeted.
    index: "amq-metrics"
    # Maximum HTTP connections to use simultaneously when sending data. Defaults to 100.
    max_connections: 20
    # Whether to disable gzip compression over HTTP. Defaults to false.
    disable_compression: false
    # HTTP timeout when sending data. Defaults to 10s.
    timeout: 10s
    # Whether to skip checking the certificate of the HEC endpoint when sending data over HTTPS. Defaults to false but we use true since we use the out-of-the-box Splunk cert.
    tls:
      insecure_skip_verify: true
Important here is the token, the HEC endpoint, the index and the insecure_skip_verify due to the nature of our dev setup.
Pipeline
Now we need to connect the receiver to the pipeline and we are good to go!
service:
    extensions: [pprof, zpages, health_check]
    pipelines:
      metrics:
        receivers: [prometheus]
        processors: [batch]
        exporters: [splunk_hec/metrics]
The result
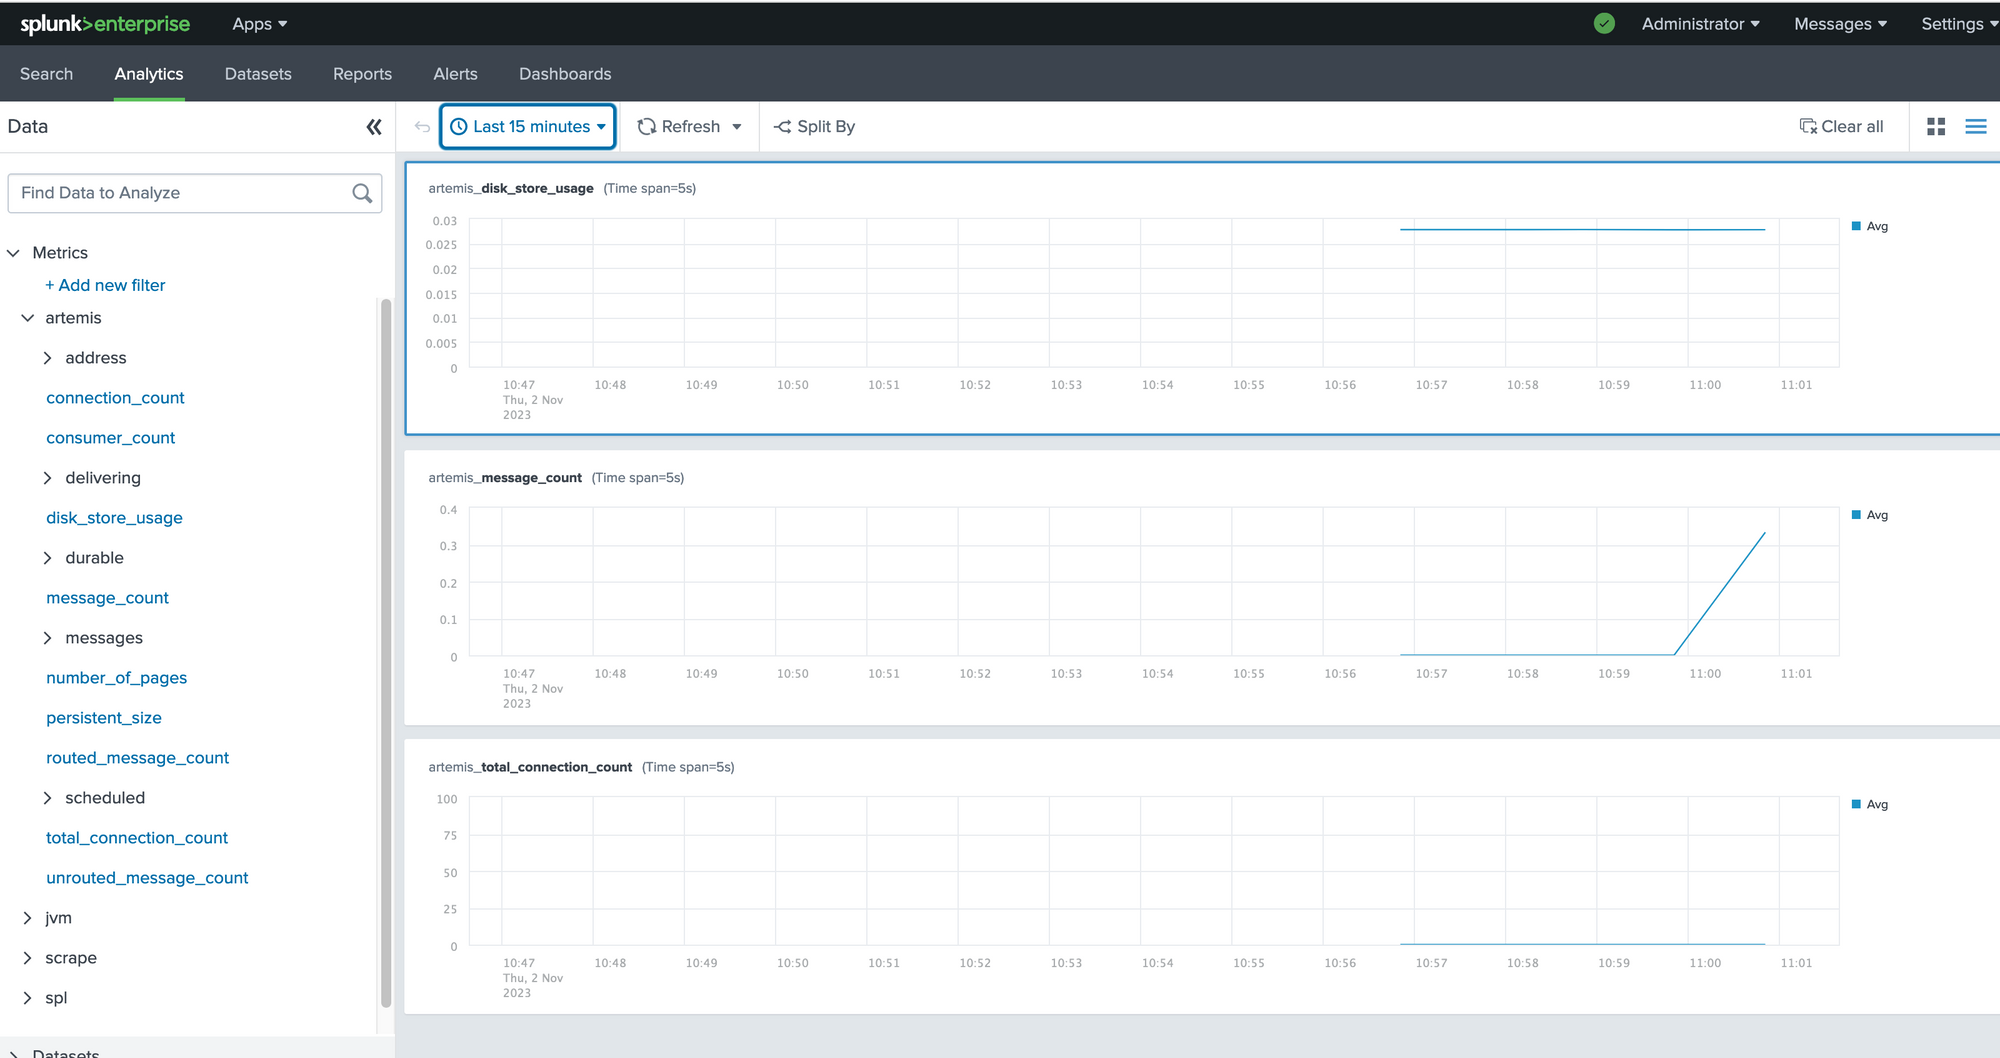
Voila! There is the data.
This is a simple example of getting metrics into Splunk Enterprise using the OTEL Collector. However, now you have seen the docker compose file you could change it to whatever you need. You can scrape Kafka metrics or NGINX metrics and send it not only to Splunk Enterprise but to whatever metrics platform you would like to use!
The full repository with the code used in this post can be found on GitHub!